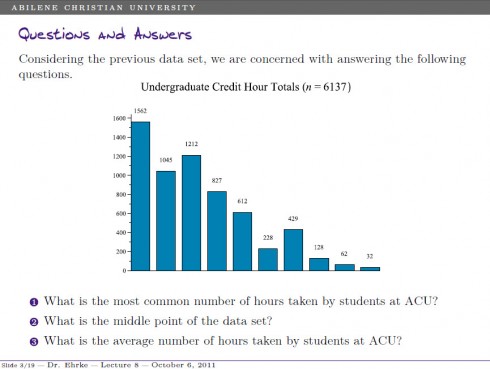
Description: Now that we have the data collected, how do we use it? In this lecture we discuss a variety of statistical measures that will help us interpret quantitative data. We consider measures of center (mean, median, mode), measures of dispersion (range, standard deviation), and discuss the five number summary and its relation to the box plot and detecting outliers.
Video Tutorials
More videos coming soon. Check back often!
Normal Distributions »

