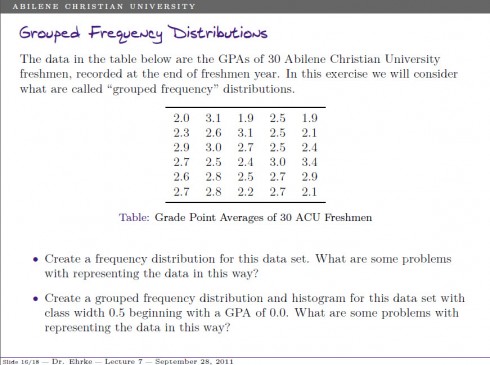
Description: In this lecture we consider the first two steps of the statistical process: data collection and organization. We will discuss sampling methods, random variables, and look at various way of visualizing data including histograms, steam and leaf plots, and frequency tables. This unit is a calculator intensive unit, so make sure you understand the calculator commands used in class.
Video Tutorials
More videos coming soon. Check back often!
Descriptive Statistics »

