Jozie Sands's Archive

Reflection

0 Commentsby   |  05.09.12  |  Reflection (P4)

The last two projects in this class were my favorites. I enjoy the consistency in screen size and color that comes with mobile products – Apple ones at least. I also enjoy the conceptual structure of apps.

I like the increased level of control I have over the user in an app setting. They have to enter into the environment of the app through the same path. In a website, the user can drop into any page they have a link to. That is fun to deal with in its own way, but also a little annoying.

Throughout the process, I’ve gotten better at – and come to enjoy – wireframing. I find it is makes the design process smoother and I end up with a better final product.

I know all the concepts I need to know to work in Photoshop, but I need to practice different styles. Right now most of my designs are pretty flat because I don’t really get along with gradients. They always look a little clunky or non-existent. I need to keep working on that.

portfolio site

0 Commentsby   |  05.09.12  |  Tutorial Links

tutorial
https://webfiles.acu.edu/users/jgs07a/web/website1/

portfolio
www.joziesands.com

Infographic final

0 Commentsby   |  05.09.12  |  Final Comps (P5)

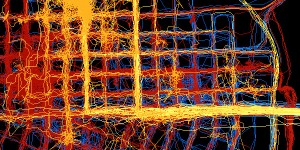
Mapping 3 years of locations

0 Commentsby   |  04.30.12  |  Inspiration (P5)

https://geoloqi.com/blog/2012/03/data-portraits-powered-by-3-5-years-of-data-and-2-5-million-gps-points/

Names

0 Commentsby   |  04.27.12  |  App Names (P5)

Graph my day
Stat-tastic
Graph it

Project 5 inspiration

0 Commentsby   |  04.25.12  |  Inspiration (P5)

This guy uses a lot of the same information we talked about collecting. This is an interactive version.

Tasks/Functionality

0 Commentsby   |  04.25.12  |  Task and/or Functionality List (P5)

Chartwell is a font that turns numbers into different types of graphs using ligatures. When paired with javascript on the web, it can pull from a database to create clean, simple graphs.

Allows the user to input additional data by texting it to the app so they don’t have to open the app.

Allows users to look back at trends over time and compare … possibly overlays of some sort

Gives users the option of buying a print of a year/month of infographics. Similar to the posters the printer in the cathedral dropped.

Real Finals

0 Commentsby   |  04.20.12  |  Final Comps (P4)


Finals

0 Commentsby   |  04.18.12  |  Final Comps (P4)


Task List

0 Commentsby   |  04.17.12  |  Task List (P4)

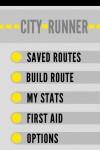
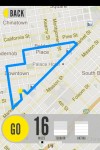
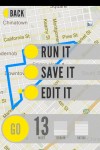
The user should be able to generate running routes in an urban area based on the difficulty and length of the route he wants to run.

The user will be able to create a schedule by saving routes.

The user will rate the route after his run and then see other routes he might enjoy based on that run.