This summer Dr. Brokaw and I took a trip to the Nature Conservancy’s Tall Grass Prairie Preserve to collect new data for our bioremediation research. I enjoyed getting the experience in field research.
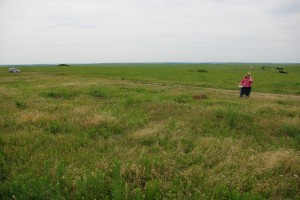
Samantha prepares to record vegetation data from a 10 meter square plot.
The first few days were spent collecting information on plant populations at the oil spill sites and control sites. I learned that the fastest way to learn a plant’s name is to have to see it and say it multiple times a day. In Plant Systematics we learned how to tell similar plants apart, but the field experience I gained on this trip really cemented some of the terms and subtle differences that can be used to distinguish two very similar species from each other.
We then collected soil samples from the research sites and from several other sites across the prairie. The tools we were using to collect the samples were more efficient than what was used last year and the soil collection did not take as long as anticipated. The best part of soil collecting was getting to roam all over the prairie while looking for our gps points.
Before heading home we went through Stillwater and met with Dr. Mike Palmer at Oklahoma State University. Dr Palmer worked on this same project with Dr. Brokaw during his masters work. We also sat in on an informal meeting and got to hear about the research that others in the department are working on.
My next task is to complete the data entry of what plants were found so that this year’s data can be compared to last year’s.
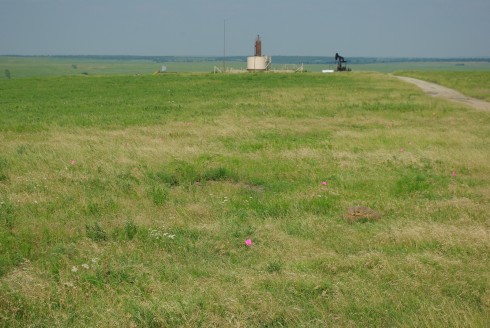
Pink flags designating the corners of vegetation plots at the site of a 1999 oil spill at the Nature Conservancy's Tallgrass Prairie Preserve.
Here are some of the technical details of our methods:
To test the hypothesis that the plant species composition differences we observed were associated with persisting hydrocarbons in the soil after the bioremediation process, plant species cover was quantified and soil samples were collected from 2010-2012 from the spill zone and the adjacent tilled control plot.
Plant species cover was quantified in June of 2011 and 2012 from four 10 × 10 m quadrats in the spill zone and two 10 × 10 m quadrats in the tilled control. Plant species cover was recorded at five spatial scales: 0.01, 0.1, 1.0, 10, and 100 m2 in each of the four corners of each 100 m2 square quadrat, and species were assigned to a percent cover class at the 100 m2 level. For use as a replicated control, 38 plots were selected randomly from a total of 151 that were located at the intersections of the 1 km x 1 km UTM grid in the TGPP, and plant species cover was recorded using the same methods as in the spill plots. We compared the species composition in the spill plots to the 38 plots on the preserve using Detrended Correspondence Analysis.
Ten soil samples were taken from the six quadrats in 2010, and soil samples were taken from each corner of each quadrat in 2011 and 2012. Each sample was composed of five composited soil cores. The soil samples were analyzed by Continental Analytical Services Inc. in 2010 for total semivolatile petroleum hydrocarbons so that we could compare hydrocarbon levels to the corresponding plant data for each site. We are now working on analyzing the 2011 and 2012 soils in collaboration with Dr. Kim Pamplin from the ACU Department of Chemistry and Biochemistry.