So, it’s been a while since I’ve posted on here. I am sorry for that. Alright, so last time I left all of you, Dr. Brokaw and I were still trying to figure out how to work the ArcGIS program to map out our climate data along with our current niche model for M. thompsonii. However, since then, we have given up. Dr. Brokaw introduced me to a new program called DIVA-GIS. This program even came with an easy to follow instruction manual that allowed us to finally make progress. With DIVA, MAXENT, and our climate data, we were able to create two different maps:
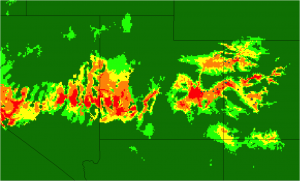
Map of locations that currently have climates suitable for Mentzelia thompsonii. Small green circles in western Colorado and eastern Utah represent current populations.
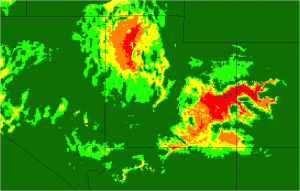
Map of locations estimated to have had climates suitable for Mentzelia thompsonii during the last glacial maximum.
These maps are only based on climate data, however, and show areas on the current possible distribution map where M. thompsonii has not been known to live. This means that we have to go into more detail with our map and introduce more variables to be more specific.
For our next project, Dr. Brokaw and I are going to introduce soil types and climate data into MAXENT and DIVA to create new maps of past, current, and future possible locations of M. thompsonii.
I will try and do a better job at keeping everyone updated as more work gets done!