This has been quite a semester for this project. It’s been a relatively discouraging process; I have often felt as though I wasn’t getting anywhere.
Yeah, I supposedly know how to use a gas chromatograph. Yeah, I know what the little lines given to me by the mass spectrometer mean. I’ve tutored [read: dragged] enough fellow classmates through Organic Chem lab write-ups and practicals that I could teach anybody how to use those machines. I could even teach you how to change the fiber glass wool filter … thingy. (It’s important.)
But that doesn’t mean when I put a tiny vial of a ~mL of concentrated hydrocarbons into the slots of a gas chromatograph, and the syringe descends into it, atomizing a tiny amount of the solution, sending it through a copper coil and through the many different sensors, that it will feel like it worked…
That doesn’t mean that I’m going to be confident that what I call results are, in fact, results. I’m probably going to sit and look at them for a while. After feeling okay enough about them and that I have gotten the information I needed from all the little peaks, I’ll probably look at it compared to the concentrations other people have found in the days of research past and feel like I messed something up.
On one of those days, when we were comparing my results to the control results we were using from a previous student’s research for this project (let’s call him Sam), Dr. B was expressing his concern that 1. our concentrations were a lot lower than expected, and 2. the graph we were using to determine the hydrocarbon concentrations in the sample was not accurate enough for our tastes at areas of low concentrations or at high concentrations. (That’s a problem.) Here’s Sam’s graph:
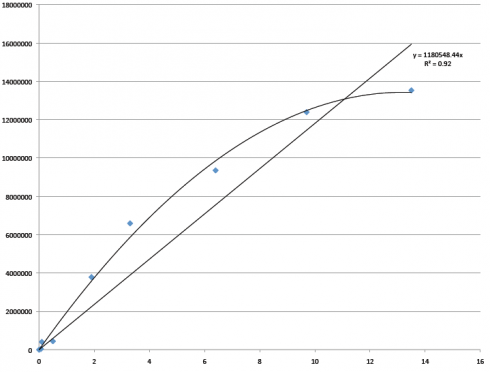
The x-axis represents the concentration in milligrams of C36H74 per milliliter of cyclohexane (C6H12); the y-axis represents the total of peak areas. So, the blue dots along that curved line are the measured peak areas of hexatriacontane (C36H74) at each concentration. These numbers are supposed to give us sort of a control in our project. That Y= equation at the top is supposed to be what we use to convert the numbers we get from the runs that I do from the oil spill samples to actual hydrocarbon concentrations in the soil.
But, that curve is a bad thing. When trying to represent the relationships of concentration ratios, a straight line is what’s desirable… By “desirable,” I mean that if your line isn’t straight, something is wrong. Either your technique is poor or your machine isn’t working well. In this case, it turns out to be a bit of both. At the top, where the line curves, it seems that the concentrations used were so high that they were breaching the detection limits of our GC… So we removed the high numbers from the graph, and it looked a little better.
When we would take the total peak areas of hydrocarbons from our soil samples and plot them, our numbers were coming in at the bottom of that line (at the low concentration levels), but not exactly in line with Sam’s numbers. (Our guess is that the concentration levels were so low — less than 1 mg C36H74 per mL of C6H12 — that he was unable to measure the tiny amounts of C36H74 accurately.) So we decided that we would start from scratch, and I would run all new concentration controls.
So I did that, and this is the graph we got:
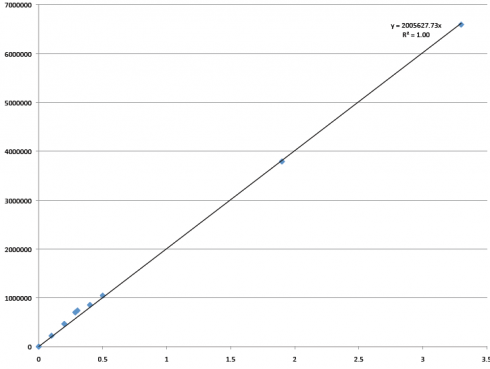
Hooray! Our line is straight! R2=1! (That’s a good thing!) This is a graph that plots all of the control samples I ran, plus two measurements from Sam that we felt were accurate (the two highest concentrations in this new graph). And it works! Now we have an equation we can use and feel good about it.
You know that moment when you finally feel like you did something right? When you finally feel like you know what you’re looking at? That you know you can move forward with confidence?
Success in science is a good feeling. Even at (or perhaps, when it comes to undergraduate research, especially at) the most basic levels.