Oklahoma, Notre Dame, Alabama, and Michigan State remain our top 4 for week 14. Ohio State’s decisive win over Michigan (#15) suggests a team that has re-awakened and moves them to 5th, bumping Clemson to 6th. Other notable teams are Iowa, up to #33 from #37 last week and Tennessee holding steady at #7. (See our first post for a brief explanation of our methodology.)
How to measure success
One of the things I teach is how to measure the quality of predictions. What good are predictions if they are no better than chance or no better than existing systems? After four weeks of college football playoff (CFP) rankings there have been 82 games involving ranked teams. After adjusting for the 4.5 point home field advantage, the CFP rankings have correctly predicted the winner 67% percent of the time, definitely better than chance (p < .002). Our JP rankings have been even better, correctly predicted the winner in 74% of those games. Most of the time our systems predict identical outcomes yet there have been 12 games in which they differed. In those 12 games, our system was correct 75% of the time, or 3 times more accurate than the CFP! Hence, I am not really concerned when our rankings look dramatically different from those of the CFP.
Though I am writing this before the CFP rankings are posted, it is likely that there will be only one game where the systems predict different winners: our system predicts Michigan State will win the Big 10 championship whereas the CFP will likely predict that Iowa will win, so that will be one game to watch.
But why is it so weird?
I want to briefly address three issues here: why is Notre Dame still #2 after their loss, why is Iowa so low and why is Tennessee so high? Notre Dame lost by less than the 4.5 point home field advantage to a very good Stanford team (#11) on the road, effectively making it a narrow win against a good team. Iowa is a 12-0 team that has had maybe one (vs. #55 Northwestern) or two (vs. #30 Nebraska) good wins. In contrast, Tennessee is 8-4 with large wins over decent opponents and four narrow losses to OU (#1), Alabama (#3), Arkansas (#8), and Florida (#14). So which is better: to defeat many lousy teams and remain undefeated or to have tight matches against very strong opponents? Our system says the latter.
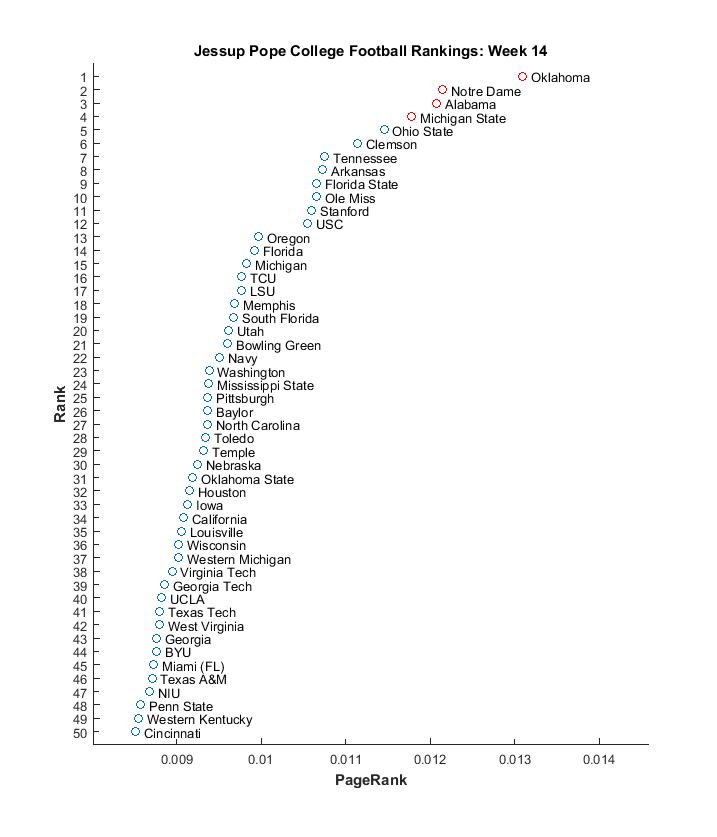
Rankings are less informative than PageRanks
Lastly, as Dr. Don Pope previously demonstrated, not only do we have ordinal rankings, we can also simultaneously display the actual PageRank values that underlie the rankings. The dot plot displays these values on the horizontal axis. Interestingly, #1 Oklahoma is further from 2nd ranked Notre Dame than Oregon (#13) is from Louisville (#35), whereas teams 23 (Washington) through 29 (Temple) have virtually identical PageRanks even though there are 5 teams between them. So the rankings carry less information than the values that produce them.