The dust has settled on yet another college football season and we can finally evaluate the “success” of our ranking system.
As a reminder, our ranking system takes Google’s PageRank algorithm, which ranks webpages based on links, and modifies it to rank teams based on scores; further, we added some additional components to try and improve the rankings. The ultimate goal of our system is to successfully predict bowl game outcomes: who wins and by how much.
So how did we do?
Well, it could have been worse. Our system ended up predicting the correct winner 51.2% of the time over all 41 bowl games, totaling 21 correct and 20 incorrect predictions. By comparison, the college football playoff (CFP) system was correct 56.3% of the time for games involving at least one top 25 team. This only includes 16 games (they were correct 9 and wrong 7 times). In those 16 games, our model got 1 fewer correct prediction (8 right, 8 wrong). Another comparison metric, perhaps the ultimate, is the Las Vegas line. Our model beat Vegas’ line 51.2% of the time, or again, 21 correct out of 41 games. So, we performed at approximately chance. Or, as Don Pope likes to say, “We did about as well as a blind squirrel flipping a coin would have done.”
Fig 1. Alternate and equally effective ranking system: A blind squirrel flipping a coin (image courtesy of ACU Acct & Fin major Caroline Thompson)
So what happened?
Let’s blame TCU. Their insanely unlikely comeback caused a 2 game ‘flip’ in all three of our accuracy scores, meaning that we had 1 fewer right and 1 additional wrong prediction when compared to (a) the overall probability correct, (b) the CFP predictions, and (c) the Vegas line. If it weren’t for that comeback, we would have beaten that squirrel.
We did predict the final very accurately (predicting a 5.7 point win for Alabama who won by 5), we missed both the Ohio State win over Notre Dame and the Georgia Southern shellacking of Bowling Green by a country mile.
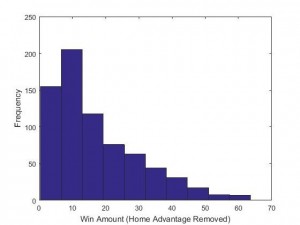
Fig 2. Regular season histogram of win amount differences
Interestingly, the favorite covered the Vegas line 61% of the time. That’s actually rather bad for Vegas as one could have merely bet that the favorite would cover the line on every game and they would have cleaned up. The weakness of that approach is that the opposite might have just as likely occurred.
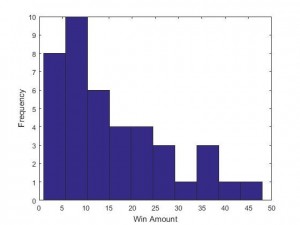
Fig 3. Bowl season histogram of win amount differences
Relatedly, another factor that may have affected our success rate was the number of blowout victories during the bowl season. Figure 2 shows the distribution of win amount differences during the regular season, a beautiful half of a normal distribution (mean=17.1, SD=13.3). However, figure 3, which demonstrates the win amount differences during the bowl season looks markedly different, particularly for everything after the 20 point range (mean=15.61, SD=12). Though we would not expect it to be as perfectly half normal as figure 2, it should look better than it does.
Moreover, because bowl game opponents are supposed to be more evenly matched – as teams are intentionally chosen to play each other so as to match quality – we would also expect the latter figure to be far narrower than it is, with very few blowout victories, having both a substantially smaller mean and SD (e.g., we predicted a mean win amount of 6.7 with SD=5.8).
Other thoughts and final musings
On the whole we have thoroughly enjoyed running our college football prediction system this season. Although it did not quite work out as well as we had hoped, there is always next year. Plus, this little exercise has helped direct us to some weaknesses in our current system worth addressing this offseason.
To close, Don and I would both like to thank MC Jennings for allowing us to make these blog posts and we hope that the readers have found them at least mildly interesting!
Previous JP rankings posts
If you are interested in learning more about our rankings, feel free to read some of our previous posts, linked below.
Post 1: Week 10: Introduction of JP ranking system and initial rankings
Post 2: Week 11: Rankings and additional information on how the system works
Post 4: Week 12: Addendum – Tears on my slide rule, or, What happened to dear old Texas A&M
Post 6: Week 14: Rankings and a measure of comparative predictive performance
Post 7: Week 15: Rankings and discussion of our system’s flaws
Post 8: Final rankings and bowl predictions
Post 9: Bowl predictions addendum
Post 10: Final analysis