
The Canvas grade calculation method is fairly robust compared to other systems. As students usually expect all their course-related information in the same place, you do not need to use Excel or any other tool for grade calculation if you have set things up properly in Canvas.
By default, Canvas calculate grades by adding up all column grades. It does not use weighted grading method unless you tell it to. With the total, non-weighted method, you will very like see a percentage rather than raw points for total grades. For instance, for students earning 800 out of a total of 1000, Canvas will display 80%.
What if you prefer to use total points (800, for instance) instead? Switching to total points is very simple:
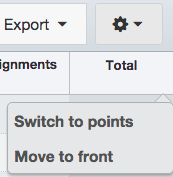
1. Mouse over the heading for the column called “total” (usually towards the very end of the page), and you will see a downward arrow, click on it.

2. Click on “switch to points”. Please note that this option is not available if you have chosen to use “weighted grading” method, because Canvas is following your logic to calculate your total grade based on the percentages you assign for each categories of assessments.
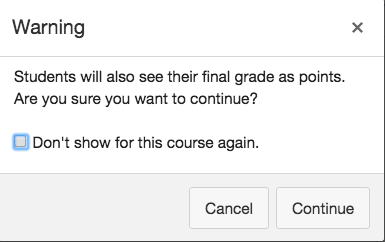
3. You will then see a warning to show that a change will happen. Click on “continue”. Also, take this as a reminder that you will need to tell students your grade display has changed from a percentage system to a total point system. Students will appreciate that notice.
Additional tips:
- Everything you grade in your course can have a column. A column does not have to be something you collect online. You can even have a column for oral presentation or attendance, for instance.
- You can move the “total” column to the front (see the second screenshot above) to display final grade together with student names so that it is easier to see how much each student has earned.
- You can click on any column’s heading to sort the scores from the lowest to the highest, or from the highest to the lowest.
- Try to make your grade book display the kind of columns your syllabus has described. Discrepancies between the two leads to anxiety and unnecessary work on your part.
- If you use weighted grading, you can use assignments tool in Canvas to create and manage groups. With weighted grading method, you can drop some low grades in a group. Let us know if you would like to help doing that.
- If you click on the name of a student in the grade book, you can see how each student’s grade is calculated. I would also encourage you to look at one of the student’s individual grade book to get familiar with their view. If you are not sure whose to look at, try students with the highest grade or the lowest grade, which will show the calculation more clearly.
- You could also experiment with the test student view. Every course has a test student. You can give the test student “fake” scores and see how that adds up in the “total” column as a way to validate your calculation method.
- You can have Canvas generate a letter grade (A,B,C,D,F, etc.) for you using a pre-defined schema.
Please contact me or David Christianson if you need any assistance with any of the above. We’d love to discuss with you in greater detail.