by M. C. Jennings | Dec 15, 2015 | Academics, COBA Faculty, Current Students, Research, Uncategorized
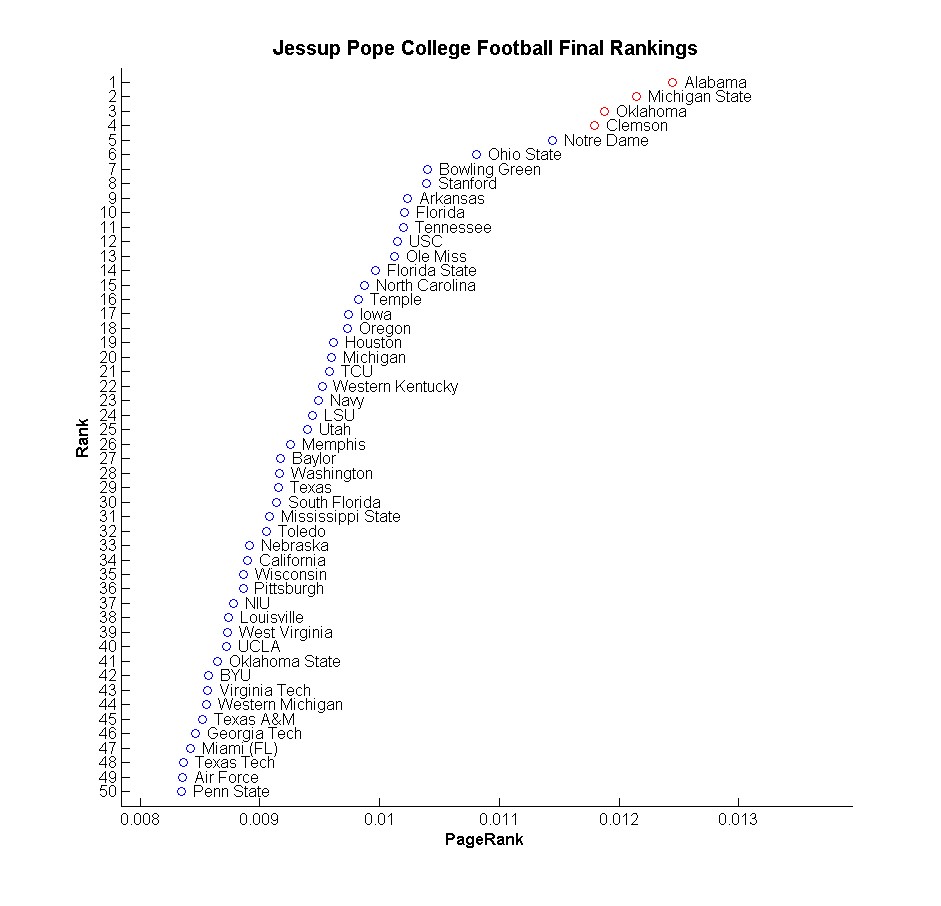
Below are the final JP rankings of the regular season. We account for the Army-Navy game in our rankings and I have no idea why the college football playoff (CFP) committee does not. Interestingly, Bowling Green has stealthily worked their way to #7, just ahead of Stanford. You might recall from our initial post that we fully expected our rankings to increasingly cohere to expectations as the season wore on (e.g., observe that we share 7 of the same top 10 as the final CFP rankings) yet nonetheless end with some surprises, and I’d say that is exactly what has happened.
Bowl game predictions
Whenever I tell people about the success of our ranking system, one of the question I am reliably asked is “yes, but how does it fare against Vegas?” I agree that Vegas is an appropriate benchmark for success in that they excel at selecting a favorite and setting an appropriate line (Vegas’ goal is for bettors to be evenly divided between the two sides of the line as that is how they make the most money with the least risk). In our first post I mentioned that we have beaten Vegas 56% of the time, a claim much easier to make than to substantiate. So here is our chance to back it up by making a priori predictions. Below you can find our forecasted winners for all 40 bowl games other than the national championship. Each of the bowl opponents are listed in the table below, the Vegas favorite is the first team listed (odds are even for the last two bowls), our projected winner is in bold, and our projected win margin is in the rightmost column.
There are two games in which we predict rather large margins of victory: Bowling Green over Georgia Southern by approximately 4 touchdowns and Arkansas over K State by more than 3 TDs. None of these teams are ranked though both of our projected winners are favored by Vegas.
Another interesting match-up involves North Carolina and Baylor: our system has had less respect for both of these teams (relative to the CFP) all season. Nonetheless, our two systems end up making the same prediction in this match: NC over Baylor. Perhaps even more curiously, Vegas favors Baylor. I find this curious because when there is disagreement between the 3 systems about the favorite, this is the least likely event (other possible events: (1) Vegas and our system align but not CFP, (2) Vegas and the CFP align but not JP).
Also, though our system favors Oklahoma over Clemson, in contrast to the CFP, Vegas currently favors OU by 4. This puts our system in the strange situation of being guaranteed to outpredict one system (either the CFP or Vegas) but virtually guaranteed to lose to the other. Only if OU wins by 1-3 points can our model beat both systems. My favorite bowls are where the CFP and Vegas align against the JP rankings, such as the Fiesta Bowl where both our competitors agree that Ohio State will defeat Notre Dame yet our system nonetheless predicts an Irish win.
Lastly, our system appears to have little respect for the Big 12 – only predicting 2 wins out of 7 games. Conversely, it expects Pac 12 and SEC teams to both win 7 out of 10 games.
| Date |
Bowl |
Vegas Favorite |
Opponent |
Predicted Win Margin |
| 2015-12-19 |
GILDAN NEW MEXICO BOWL |
Arizona |
New Mexico |
2.3 |
| 2015-12-19 |
ROYAL PURPLE LAS VEGAS BOWL |
Utah |
BYU |
5.7 |
| 2015-12-19 |
RAYCOM MEDIA CAMELLIA BOWL |
Appalachian State |
Ohio |
5.7 |
| 2015-12-20 |
AUTONATION CURE BOWL |
San Jose State |
Georgia State |
5.7 |
| 2015-12-20 |
R+L CARRIERS NEW ORLEANS BOWL |
Louisiana Tech |
Arkansas State |
5.7 |
| 2015-12-21 |
MIAMI BEACH BOWL |
Western Kentucky |
South Florida |
2.3 |
| 2015-12-22 |
FAMOUS IDAHO POTATO BOWL |
Utah State |
Akron |
5.7 |
| 2015-12-23 |
MARMOT BOCA RATON BOWL |
Temple |
Toledo |
5.7 |
| 2015-12-23 |
SAN DIEGO COUNTY CREDIT UNION POINSETTIA BOWL |
Boise State |
NIU |
10.7 |
| 2015-12-24 |
GODADDY BOWL |
Bowling Green |
Georgia Southern |
28.7 |
| 2015-12-24 |
POPEYES BAHAMAS BOWL |
Western Michigan |
Middle Tennessee |
13.3 |
| 2015-12-25 |
HAWAI’I BOWL |
Cincinnati |
San Diego State |
1.0 |
| 2015-12-26 |
ST. PETERSBURG BOWL |
Marshall |
Connecticut |
2.3 |
| 2015-12-26 |
HYUNDAI SUN BOWL |
Washington State |
Miami (FL) |
2.3 |
| 2015-12-26 |
ZAXBY’S HEART OF DALLAS BOWL |
Washington |
Southern Miss |
10.7 |
| 2015-12-26 |
NEW ERA PINSTRIPE BOWL |
Indiana |
Duke |
8.3 |
| 2015-12-26 |
CAMPING WORLD INDEPENDENCE BOWL |
Virginia Tech |
Tulsa |
8.3 |
| 2015-12-27 |
FOSTER FARMS BOWL |
UCLA |
Nebraska |
1.0 |
| 2015-12-28 |
MILITARY BOWL PRESENTED BY NORTHROP GRUMMAN |
Navy |
Pittsburgh |
5.7 |
| 2015-12-28 |
QUICK LANE BOWL |
Minnesota |
Central Michigan |
2.3 |
| 2015-12-29 |
LOCKHEED MARTIN ARMED FORCES BOWL |
California |
Air Force |
5.7 |
| 2015-12-29 |
RUSSELL ATHLETIC BOWL |
Baylor |
North Carolina |
5.7 |
| 2015-12-30 |
NOVA HOME LOANS ARIZONA BOWL |
Colorado State |
Nevada |
2.3 |
| 2015-12-30 |
ADVOCARE V100 TEXAS BOWL |
LSU |
Texas Tech |
8.3 |
| 2015-12-30 |
BIRMINGHAM BOWL |
Auburn |
Memphis |
8.3 |
| 2015-12-30 |
BELK BOWL |
Mississippi State |
NC State |
10.7 |
| 2015-12-31 |
FRANKLIN AMERICAN MORTGAGE MUSIC CITY BOWL |
Texas A&M |
Louisville |
1.0 |
| 2015-12-31 |
HOLIDAY BOWL |
USC |
Wisconsin |
10.7 |
| 2015-12-31 |
CHICK-FIL-A PEACH BOWL |
Florida State |
Houston |
2.3 |
| 2015-12-31 |
CAPITAL ONE ORANGE BOWL – CFP SEMIFINAL |
Oklahoma |
Clemson |
1.0 |
| 2016-01-01 |
GOODYEAR COTTON BOWL – CFP SEMIFINAL |
Alabama |
Michigan State |
2.3 |
| 2016-01-01 |
OUTBACK BOWL |
Tennessee |
Northwestern |
16.3 |
| 2016-01-01 |
BUFFALO WILD WINGS CITRUS BOWL |
Michigan |
Florida |
5.7 |
| 2016-01-01 |
BATTLEFROG FIESTA BOWL |
Ohio State |
Notre Dame |
5.7 |
| 2016-01-01 |
ROSE BOWL GAME PRES. BY NORTHWESTERN MUTUAL |
Stanford |
Iowa |
5.7 |
| 2016-01-02 |
ALLSTATE SUGAR BOWL |
Ole Miss |
Oklahoma State |
13.3 |
| 2016-01-02 |
TAXSLAYER BOWL |
Georgia |
Penn State |
1.0 |
| 2016-01-02 |
AUTOZONE LIBERTY BOWL |
Arkansas |
Kansas State |
21.7 |
| 2016-01-02 |
VALERO ALAMO BOWL |
Oregon |
TCU |
1.0 |
| 2016-01-03 |
MOTEL 6 CACTUS BOWL |
West Virginia |
Arizona State |
5.7 |
| 2016-01-12 |
CFP NATIONAL CHAMPIONSHIP GAME PRESENTED BY AT&T |
TBD |
TBD |
|
Previous JP rankings posts
If you are interested in learning more about our rankings, feel free to read some of our previous posts, linked below.
Post 1: Week 10: Introduction of JP ranking system and initial rankings
Post 2: Week 11: Rankings and additional information on how the system works
Post 3: Week 12: Rankings
Post 4: Week 12: Addendum – Tears on my slide rule, or, What happened to dear old Texas A&M
Post 5: Week 13: Rankings
Post 6: Week 14: Rankings and a measure of comparative predictive performance
Post 7: Week 15: Rankings and discussion of our system’s flaws
Post 8: Final rankings and bowl predictions
by M. C. Jennings | Dec 8, 2015 | Academics, COBA Faculty, Current Students, Research, Uncategorized
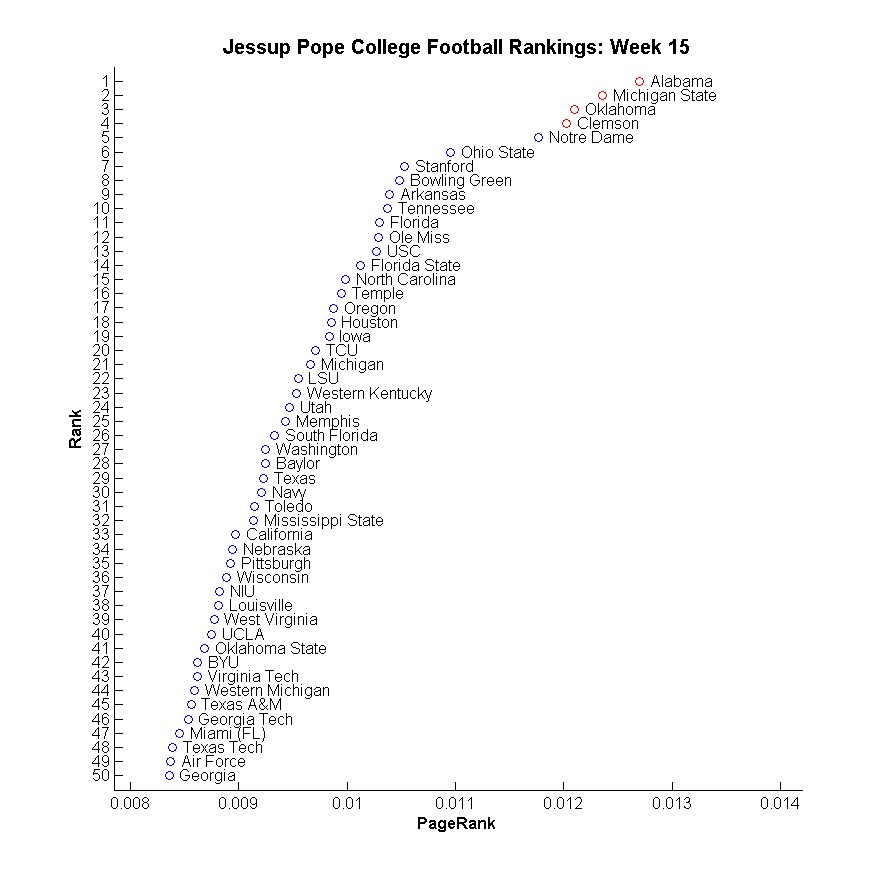
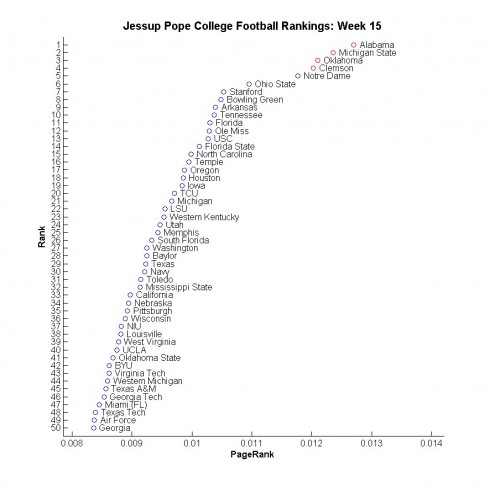
Alabama, Michigan State, Oklahoma, and Clemson are our top 4 teams, respectively, for week 15. Notre Dame falls to 5th, Ohio State is bumped to 6th, and Stanford rose to No. 7 on the strength of their strong win over USC (#13). All the major moves were by teams that played this weekend and most of their moves were upwards. Strangely, Texas (#29) has two wins over top 25 college football playoff (CFP) teams – there are very few teams out there with that distinction!
Prediction quality measurement
Out of the 87 games involving teams ranked in the CFP top 25, the CFP continues to correctly predict the winner (adjusted for home field advantage) 67% of the time. We can actually compute the probability of being that successful out of 87 games if you are purely guessing: it happens less than .001 of the time, or less than 1 in 1000 attempts. We look at something called a binomial distribution to obtain this “p value.” Our model continues to outperform the CFP system, correctly predicting the outcome 74% of the time for these same games. As of this weekend there have been only 14 games in which our system makes a different prediction than the CFP rankings and ours has “won” this competition 10 times. If our two systems were equal in predictive ability, then the probability of this happening would be less than .029, or about once in 35 tries.
A bug – or a feature?
George Box famously said “all models are wrong, but some are useful.” Similarly, we know that our system is flawed and this process of producing rankings each week has brought some of those flaws to the forefront. One of the goals of successful modeling is to seek out flaws so as to eliminate or minimize them. If we are trying to build better models, what good would it do to hide the flaws?
The primary weakness we have found in our system is that teams which play more games are ranked higher than those that play fewer games. In fact, nearly every team that played this weekend, win or lose, moved up in our rankings due to this fact. This clarifies why Clemson edged back into the top 4 and Notre Dame fell out – all three teams that moved ahead of them played this weekend. (On a sidenote, I am genuinely bummed that we have the exact same top four – though in a different order – as the CFP.) This flaw might also explain why we expected a large Michigan State win over Iowa and a narrow Stanford win over USC when in fact they won narrowly and largely, respectively. This issue is definitely one we will address in our college football offseason. Interestingly, the fact that our model is working better than its primary competitor, the CFP, suggests that it might be a feature instead of a bug!
In later posts, we will present some additional comparative analysis of our rankings and, further, list our predicted bowl winners and win margins.
Previous JP rankings posts
If you are interested in learning more about our rankings, feel free to read some of previous posts, linked below.
Post 1: Week 10: Introduction of JP ranking system and initial rankings (week 10)
Post 2: Week 11: Rankings and additional information on how the system works
Post 3: Week 12: Rankings
Post 4: Week 12: Addendum – Tears on my slide rule, or, What happened to dear old Texas A&M
Post 5: Week 13: Rankings
Post 6: Week 14: Rankings and a measure of comparative predictive performance
by M. C. Jennings | Dec 1, 2015 | Academics, COBA Faculty, Research, Uncategorized
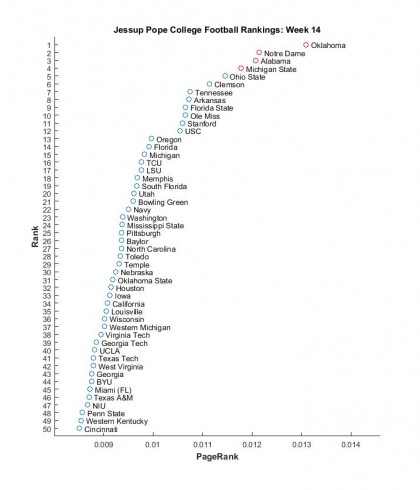
Oklahoma, Notre Dame, Alabama, and Michigan State remain our top 4 for week 14. Ohio State’s decisive win over Michigan (#15) suggests a team that has re-awakened and moves them to 5th, bumping Clemson to 6th. Other notable teams are Iowa, up to #33 from #37 last week and Tennessee holding steady at #7. (See our first post for a brief explanation of our methodology.)
How to measure success
One of the things I teach is how to measure the quality of predictions. What good are predictions if they are no better than chance or no better than existing systems? After four weeks of college football playoff (CFP) rankings there have been 82 games involving ranked teams. After adjusting for the 4.5 point home field advantage, the CFP rankings have correctly predicted the winner 67% percent of the time, definitely better than chance (p < .002). Our JP rankings have been even better, correctly predicted the winner in 74% of those games. Most of the time our systems predict identical outcomes yet there have been 12 games in which they differed. In those 12 games, our system was correct 75% of the time, or 3 times more accurate than the CFP! Hence, I am not really concerned when our rankings look dramatically different from those of the CFP.
Though I am writing this before the CFP rankings are posted, it is likely that there will be only one game where the systems predict different winners: our system predicts Michigan State will win the Big 10 championship whereas the CFP will likely predict that Iowa will win, so that will be one game to watch.
But why is it so weird?
I want to briefly address three issues here: why is Notre Dame still #2 after their loss, why is Iowa so low and why is Tennessee so high? Notre Dame lost by less than the 4.5 point home field advantage to a very good Stanford team (#11) on the road, effectively making it a narrow win against a good team. Iowa is a 12-0 team that has had maybe one (vs. #55 Northwestern) or two (vs. #30 Nebraska) good wins. In contrast, Tennessee is 8-4 with large wins over decent opponents and four narrow losses to OU (#1), Alabama (#3), Arkansas (#8), and Florida (#14). So which is better: to defeat many lousy teams and remain undefeated or to have tight matches against very strong opponents? Our system says the latter.
Rankings are less informative than PageRanks
Lastly, as Dr. Don Pope previously demonstrated, not only do we have ordinal rankings, we can also simultaneously display the actual PageRank values that underlie the rankings. The dot plot displays these values on the horizontal axis. Interestingly, #1 Oklahoma is further from 2nd ranked Notre Dame than Oregon (#13) is from Louisville (#35), whereas teams 23 (Washington) through 29 (Temple) have virtually identical PageRanks even though there are 5 teams between them. So the rankings carry less information than the values that produce them.
by M. C. Jennings | Nov 24, 2015 | Academics, COBA Faculty, Current Students, Research, Uncategorized
Now that week 12 is in the record books, the College Football Playoff (CFP) selection committee will meet today and update their rankings which are a big deal because, when the smoke clears at the end of the college season, the top 4 ranked teams will play in the playoff bowl games to determine the overall number one team. Teams 5,6,… are left to play in such memorable bowl games as the Tidy Bowl.
So, I am sitting here by the phone, waiting for the CFP committee to call for advice. You see, over the last 3 weekends, the Jessup Pope (JP) ranking system has predicted 75% correctly for games involving top 25 teams, while predictions based on the weekly CFP rankings only got 66% correct.
Just in case you are wondering, our top 4 are now Oklahoma, Notre Dame, Alabama, and Michigan State. Clemson and Arkansas are the next 2 teams “on the bubble” of making it in. Our JP rankings continue to be less impressed with our regional favorites TCU, Baylor, and Okie State.
Surely the phone will ring any minute now….
by M. C. Jennings | Nov 19, 2015 | Academics, COBA Faculty, Current Students, Research, Uncategorized
I am enjoying my research with Dr. Ryan Jessup about the applications of Google’s page rank algorithm to other uses, including ranking sports teams. Believe it or not, this stuff actually relates to the courses that I teach at ACU. This data crunching and analysis of college football results involves statistics, mathematical optimization and model fitting, and cause-effect analysis, all of which relate to the 3 courses that I am teaching this semester: Statistics, Management Science, and Quality Management.
Now, about the title of this blog post. I am a proud Aggie Industrial Engineer, and it hurt my pride enormously when my Aggies dropped from our carefully calculated rank of 32 to 52 after the Saturday November 14th weekend. You see, our algorithm does not accept game results when a big school like Texas A&M plays “Roast Beef Tech” (with apologies to Western Carolina fans). So, A&M dropped in our rankings below such traditional football powers as Bowling Green and those unworthy academic establishments in Austin and Lubbock, Texas. Wow. That hurts.

by M. C. Jennings | Nov 12, 2015 | Academics, COBA Faculty, Current Students, Research
Here are the JP College Football Rankings after the 10th week of the season. (See our first post for a brief explanation of our methodology.)
Our top two teams, Notre Dame and Clemson, remain unchanged and Alabama’s big win over LSU moved them from 6th to 3rd place. Notice that ours and the College Football Playoff (CFP) rankings agree on 3 out of the 4 top. Yet here is one way we can see a dramatic difference between our ranking system and the more traditional polls and rankings.
In our rankings last week, Michigan State and Michigan were 9 and 10, respectively. This week, Michigan State, who lost, moved up 2 positions and Michigan, who won, moved down 4 places. This is because the former narrowly lost on the road to a decent Nebraska team (#19) whereas the latter won at home against a very weak Rutgers side (#104). Similar movements occurred all throughout our rankings. Another major difference between ours and more traditional ranking systems is that ours is forward-looking, meaning it is meant to predict future outcomes whereas more traditional systems are primarily designed to reward past performance. This is why a 3 loss USC is ranked 4th in our system (#3 last week) yet they are outside the top 25 of the AP poll. Baylor remains unchanged from last week at #60. A good performance against a very strong OU team (#5) this Saturday will probably see them rise, even with a loss. The top 50 teams are listed at the end of this blog post.
Relationship with courses we teach
One might reasonably ask what this has to do with the courses we teach. It turns out, quite a lot! For example, one of the courses I teach, data mining, initially involves separating data into two datasets or partitions. We then run our algorithm on the first partition to teach it. Next, we examine how well it forecasts the results in the second partition. This is exactly how we came up with these rankings. The benefit of this partitioning process is that when we say that we can beat the Vegas line 56% of the time, it means we are beating it on new data, not merely data that our algorithm used to learn. It is actually very easy to “predict” results that you are using to learn; what is hard is predicting or rather forecasting results that are new. In a later post we’ll discuss some of these ideas and their relationship with what we teach in greater detail. We will also examine other research applications of this ranking system.
| 1 |
Notre Dame |
| 2 |
Clemson |
| 3 |
Alabama |
| 4 |
USC |
| 5 |
Oklahoma |
| 6 |
Tennessee |
| 7 |
Michigan State |
| 8 |
Stanford |
| 9 |
Utah |
| 10 |
Florida |
| 11 |
LSU |
| 12 |
Ohio State |
| 13 |
Florida State |
| 14 |
Michigan |
| 15 |
Oklahoma State |
| 16 |
Mississippi State |
| 17 |
Wisconsin |
| 18 |
Ole Miss |
| 19 |
Nebraska |
| 20 |
Penn State |
| 21 |
Washington |
| 22 |
Texas |
| 23 |
TCU |
| 24 |
Louisville |
| 25 |
California |
| 26 |
Georgia Tech |
| 27 |
Navy |
| 28 |
Temple |
| 29 |
Arkansas |
| 30 |
BYU |
| 31 |
Texas A&M |
| 32 |
Pittsburgh |
| 33 |
Cincinnati |
| 34 |
Texas Tech |
| 35 |
Iowa |
| 36 |
UCLA |
| 37 |
South Carolina |
| 38 |
Bowling Green |
| 39 |
Memphis |
| 40 |
East Carolina |
| 41 |
Central Michigan |
| 42 |
North Carolina |
| 43 |
Auburn |
| 44 |
Oregon |
| 45 |
West Virginia |
| 46 |
Virginia |
| 47 |
NIU |
| 48 |
Western Kentucky |
| 49 |
Houston |
| 50 |
Northwestern |