
Do you know that students can see how their grades compare with their peers in class?
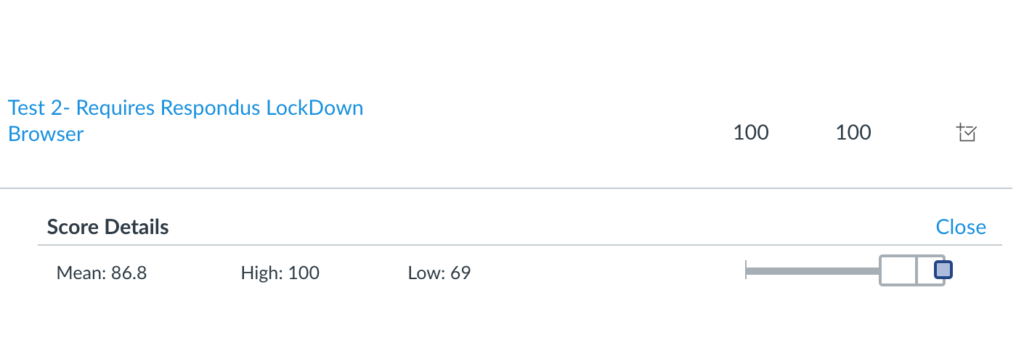
When students go to their grades in Canvas, they can click on “show all details,”
which would then show the “mean,” “high,” “low” of that graded assignment, as well as an overall distribution chart to show where they stand in class regarding this assignment.
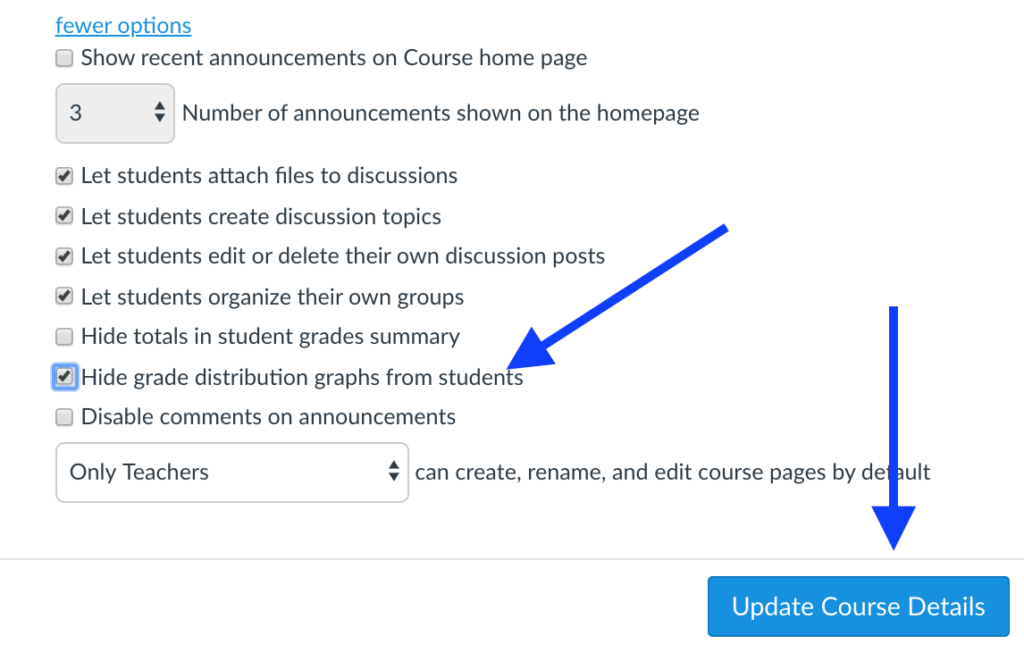
If such comparisons become counter-productive for your students or your teaching, you can disable the feature. Here is how to do that:
Go to course settings, click on “more options” towards the end of the page, and then check “hide grade distribution graphs from students,” and remember to “update course settings” to save the change.
At this point, Canvas does not have an option to make it a default value for courses. Remember to check this option at the start of a semester. Once hidden, it stays hidden until you turn it back on. If you have questions about this and other grade display or calculation issues, please contact us at the Adams Center.